
Page 187 - 《高原气象》2025年第5期
P. 187
5 期 徐新妍等:川西北生态示范区及周边地区极端气温指数时空变化分布特征 1305
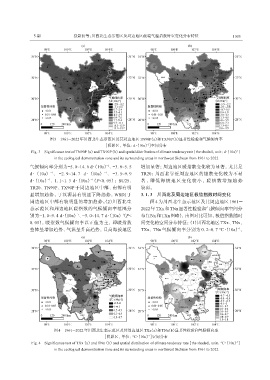
图3 1961 -2022年川西北生态示范区及其周边地区TN90P(a)和TX90P(b)显著性检验和气候倾向率
[阴影区, 单位: d·(10a)]空间分布
-1
-1
Fig. 3 Significance test of TN90P (a) and TX90P (b) and spatial distribution of climate tendency rate [the shaded, unit: d·(10a)]
in the ecological demonstration zone and its surrounding areas in northwest Sichuan from 1961 to 2022
气候倾向率分别为-5. 0~14. 6 d·(10a) 、 -3. 8~5. 5 增加显著; 周边地区暖指数变化较为显著, 尤其是
-1
-1
-1
d·(10a) 、 -2. 9~14. 7 d·(10a) 、 -3. 5~9. 9 TR20; 川西北靠近周边地区的指数变化较为不显
-1
d·(10a) 、 1. 1~1. 3 d·(10a) (P<0. 05); SU25、 著 , 即 低 海 拔 地 区 变 化 较 小 , 暖 指 数 增 加 趋 势
-1
TR20、 TN90P、 TX90P 于周边地区中部、 南部有明 较弱。
显增加趋势, 于汉源县有明显下降趋势, WSDI 于 3. 1. 3 川西北及周边地区极值指数时间变化
周边地区中部有较明显的增加趋势。(2)川西北生 图 4 为川西北生态示范区及其周边地区 1961 -
态示范区和周边地区暖指数的气候倾向率范围分 2022年TXx和TNn显著性检验和气候倾向率空间分
别为-1. 0~9. 4 d·(10a) 、 -5. 0~14. 7 d·(10a)(P< 布(TNx和TXn图略), 由图对比可知, 极值指数随时
-1
-1
0. 05), 暖指数气候倾向率以正值为主, 即暖指数 间变化的空间分布特征: (1)川西北地区TXx、 TNx、
整体呈增加趋势、 气温呈升高趋势, 且高海拔地区 TXn、 TNn 气候倾向率分别为 0. 2~0. 7 ℃·(10a) 、
-1
图4 1961 -2022年川西北生态示范区及其周边地区TXx(a)和TNn(b)显著性检验和气候倾向率
[阴影区, 单位: ℃·(10a)]空间分布
-1
Fig. 4 Significance test of TXx (a) and TNn (b) and spatial distribution of climate tendency rate [the shaded, unit: ℃·(10a)]
-1
in the ecological demonstration zone and its surrounding areas in northwest Sichuan from 1961 to 2022