
Page 122 - 《高原气象》2025年第3期
P. 122
高 原 气 象 44 卷
680
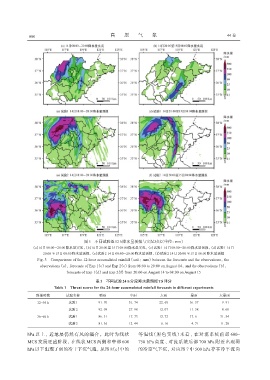
图5 不同试验逐12 h降水量预报与实况对比(单位: mm)
(a)14日08:00 -20:00降水量实况, (b)14日20:00至15日08:00降水量实况, (c)试验1 14日08:00 -20:00降水量预报, (d)试验1 14日
20:00至15日08:00降水量预报, (e)试验2 14日08:00 -20:00降水量预报, (f)试验2 14日20:00至15日08:00降水量预报
Fig. 5 Comparisons of the 12-hour accumulated rainfall (unit: mm) between the forecasts and the observations, the
observations (a), forecasts of Exp 1(c) and Exp 2(e) from 08:00 to 20:00 on August 14, and the observations (b),
forecasts of Exp 1(d) and Exp 2(f) from 20:00 on August 14 to 08:00 on August 15
表1 不同试验24 h分段降水量预报TS评分
Table 1 Threat scores for the 24-hour accumulated rainfall forecasts in different experiments
预报时效 试验名称 晴雨 中雨 大雨 暴雨 大暴雨
12~36 h 试验1 91. 70 31. 74 22. 60 16. 37 9. 91
试验2 92. 09 27. 98 12. 07 11. 38 8. 68
36~60 h 试验1 86. 31 17. 73 12. 72 17. 6 31. 54
试验2 81. 36 12. 44 6. 16 4. 71 11. 28
hPa 以上, 近地层仍然有风的辐合。此时为线状 等温线(黑色实线)来看, 在对流系统前部 600~
MCS 发展旺盛阶段, 在线状 MCS 两侧和中部 600 750 hPa 高度、 对流系统后部 700 hPa 附近出现弱
hPa 以下出现了弱的冷干下沉气流, 从图 8(c)中的 的冷空气下沉, 对应图 7 中 500 hPa 存在冷平流向