
Page 239 - 《高原气象》2022年第6期
P. 239
高 原 气 象 41 卷
1602
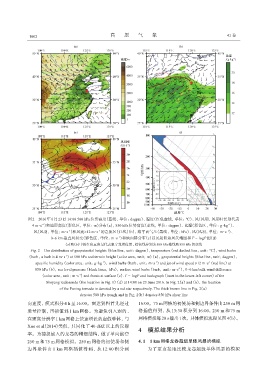
图2 2016年6月23日14:00 500 hPa位势高度(蓝线,单位:dagpm)、温度(红色虚线,单位:℃)、风(风羽,风羽杆长划代表
-1
-1
4 m·s )和地形高度(彩色区,单位:m)分布(a),850 hPa位势高度(蓝线,单位:dagpm)、比湿(彩色区,单位:g·kg )、
-1
风(风羽,单位:m·s )和风速≥12 m·s 的急流区(红线)(b),海平面气压(黑线,单位:hPa)、风(风羽,单位:m·s )、
-1
-1
-1
0~6 km垂直风切变(彩色区,单位:m·s )和地面锋分布(c)以及射阳站风矢端图和T - logP图(d)
(a)和(b)中的红色五角星代表阜宁龙卷位置,棕色线分别为500 hPa槽线和850 hPa切变线
Fig. 2 The distribution of geopotential heights(blue line,unit:dagpm),temperature(red dashed line,unit:℃),wind barbs
-1
(barb,a barb is 4 m·s )at 500 hPa and terrain height(color area,unit:m)(a),geopotential heights(blue line,unit:dagpm),
-1
-1
-1
specific humidity(color area,unit:g·kg ),wind barbs(barb,unit:m·s )and jet of wind speed ≥12 m·s (red line)at
-1
850 hPa(b),sea level pressure(black lines,hPa),surface wind barbs(barb,unit:m·s ),0~6 km bulk wind difference
-1
(color area,unit:m·s )and fronts at surface(c). T - logP and hodograph(inset in the lower-left corner)of the
Sheyang radiosonde(the location in Fig. 1)(d)at 14:00 on 23 June 2016. In Fig. 2(a)and(b),the location
of the Funing tornado is denoted by a red star respectively. The thick brown line in Fig. 2(a)
denotes 500 hPa trough and in Fig. 2(b)denotes 850 hPa shear line
向速度,模式积分 4 h 至 16:00。雷达资料首先经过 16:00。75 m网格的初使场和侧边界条件由250 m网
质量控制,再插值到 1 km 网格。为避免引入弱的、 格插值得到,从 13:30 积分到 16:00,250 m 和 75 m
在更高分辨率1 km网格上快速增长的虚假单体,与 网格模拟每20 s输出1次,具体模拟流程见图4(b)。
Xue et al(2014)类似,只同化了 40 dBZ 以上的反射
4 模拟结果分析
率。为捕捉嵌入的龙卷的精细结构,做了单向嵌套
250 m 和 75 m 网格模拟。250 m 网格的初使场和侧 4. 1 1 km网格龙卷超级单体风暴的模拟
边界条件由 1 km 网格插值得到,从 12:00 积分到 为了更直接地比较龙卷超级单体风暴的模拟