Page 249 - 《高原气象》2022年第1期
P. 249

1 期                         卢   珊等:黄土高原夏季极端降水及其成因分析                                        247
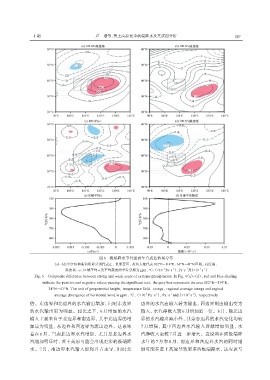


                                              图6   极端降水事件强弱年合成差值场分布
                         (a)~(d)中红色和蓝色阴影分别代表正、负显著区,灰色方框代表102°E-114°E,34°N-41°N区域,高度场、
                                                                               -1
                                                                           -2
                                                                                           -5
                                                                                             -1
                                                                                     -1
                               温度场、ω、区域平均ω及平均散度的单位分别为gpm、℃、(×10 Pa·s )、Pa·s 及(×10 s )
                 Fig. 6  Composite difference between strong and weak years of extreme precipitation. In Fig. 6(a)~(d),red and blue shading
                    indicate the positive and negative values passing the significant test,the grey box represents the area 102°E-114°E,
                       34°N-41°N. The unit of geopotential height,temperature field,omega,regional average omega and reginal
                                                                   -2
                                                                        -1
                                                                                        -1
                                                                              -1
                                                                                      -5
                          average divergence of horizontal wind is gpm,℃,(×10 Pa·s ),Pa·s and(×10 s ),respectively
               倍。东边界和北边界的水汽输出增加,同时东边界                            边界的水汽由输入转为输出,西边界则由输出变为
               的水汽输出更为明显。相比之下,6 月增加的水汽                           输入,水汽净收入较 6月增加近一倍。8月,除北边
               输入主要来自于北边界和南边界,其中北边界的增                            界的水汽输出减小外,其余各边界的水汽变化均较
               加最为明显,东边界和西边界为流出边界。这意味                            7 月增强,其中西边界水汽输入贡献增加明显,水
               着在 6 月,当南北边界水汽增加,尤其是北边界水                          汽净收入也较 7月进一步增大。这说明在强极端降
               汽增加明显时,黄土高原可能会出现更多的极端降                            水年的 7 月和 8 月,南边界和西边界水汽的同时增
               水。7 月,南边界水汽输入加强并占主导,同时北                           加可能在黄土高原导致更多的极端降水,这应该与
   244   245   246   247   248   249   250   251   252   253   254