
Page 255 - 《高原气象》2021年第5期
P. 255
高 原 气 象 40 卷
1216
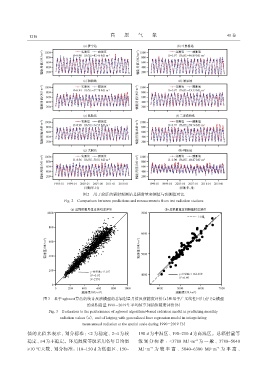
图2 用于验证的辐射观测站总辐射量实测值与预测值对比
Fig. 2 Comparison between predictions and measurements from test radiation stations
图3 基于xgboost算法的统计反演模型的总辐射量月值反演精度评价(a)和基于广义线性回归克里金模型
的总辐射量1990-2019年平均值空间插值精度评价(b)
Fig. 3 Evaluation to the performance of xgboost algorithms-based radiation model in predicting monthly
radiation values(a),and of kriging with generalized liner regression model in interpolating
mean annual radiation at the spatial scale during 1990-2019(b)
值的比值来表示,划分标准:<2 为稳定、2~4 为较 190 d 为中温区、190~210 d 为高温区。总辐射量等
-2
稳定、≥4为不稳定。环境温度等级采用各年日均温 级 划 分 标 准 :<3780 MJ·m 为 一 般 、3780~5040
-2
≥10 ℃天数,划分标准:110~150 d 为低温区、150~ MJ·m 为 较 丰 富 、5040~6300 MJ·m 为 丰 富 、
-2