


Page 105 - 《爆炸与冲击》2026年第11期
P. 105
第 46 卷             李    腾,等: 头部锥角对弹体高速入水流场变化特性的影响                              第 11 期

                     3.0                                                                      Test
                             Test                                  110
                             Simulation                                                       Simulation
                     2.5
                                                                  108
                    Displacement/m  1.5                          Velocity/(m·s −1 )  106
                     2.0
                                                                  104
                     1.0
                                                                  102
                     0.5
                                                                  100
                      0      5    10    15    20    25               0     5    10    15    20    25
                                     Time/ms                                       Time/ms
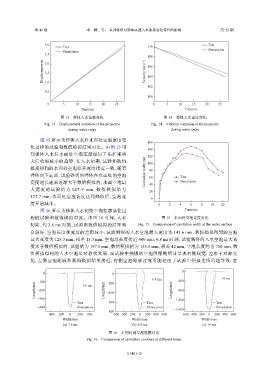
                            图 13    弹体入水位移变化                              图 14    弹体入水速度变化
                     Fig. 13    Displacement variation of the projectile  Fig. 14    Velocity variation of the projectile
                               during water entry                            during water entry

                   图  15  所示为弹体入水后水面处空泡宽度变                        160
               化过程的试验和数值模拟结果对比。由图                    15  可        140
               知弹体入水后水面处空泡宽度经历了先扩张增
               大后收缩减小的趋势,在入水初期,试验和数值                              100
               模拟得到的水面处空泡张开宽度接近一致,随着                             Cavitation width/mm 120
                                                                   80
               弹体向下运动,试验得到的弹体在水面处的空泡                               60            Test
               宽度增长速率逐渐大于数值模拟的,水面空泡最                               40            Simulation
               大  宽  度  的  试  验  值  为  147.9 mm, 数  值  模  拟  值  为  20
               127.7 mm,水面处空泡宽度达到峰值后,空泡宽                            0
               度开始减小。                                                  0    2    4   6    8   10   12
                   图  16  所示为弹体入水初期空泡轮廓演化过                                         Time/ms
               程的试验和数值模拟对比。由图                16  可知,入水                   图 15    水面处空泡宽度对比
               初期,约   3.6 ms 时刻,试验和数值模拟的结果吻                   Fig. 15    Comparison of cavitation width at the water surface
               合较好,空泡长度和宽度的差距较小,试验测得的入水空泡最大宽度为                                143.6 mm,数值模拟得到的空泡
               最大宽度为     128.3 mm,相差   15.3 mm,空泡总长度接近         400 mm;6.8 ms 时刻,试验测得的入水空泡最大宽
               度大于数值模拟的,试验值为             197.5 mm,数值模拟值为       155.5 mm,相差   42 mm,空泡长度约为        750 mm,数
               值模拟得到的入水空泡呈对称状发展,而试验中拍摄的空泡图像则明显呈现右侧较宽,左右不对称变
               化,左侧空泡轮廓和数值模拟结果接近,右侧空泡轮廓过宽可能是由于试验中拍摄光线问题导致;在
                                                                                  0
                    0                              0
                                                                     6.8 ms                        14 ms
                  −100                3.6 ms    −200                           −400
                Length/mm  −200                Length/mm  −400               Length/mm  −800

                  −300
                                   Test         −600              Test        −1 200             Test
                  −400             Simulation                     Simulation                     Simulation
                                                −800                          −1 600
                      −400 −200  0  200  400       −600 −400 −200 0  200 400 600  −600 −400 −200 0  200 400 600
                             Width/mm                       Width/mm                      Width/mm
                             (a) 3.6 ms                     (b) 6.8 ms                     (c) 14 ms

                                                 图 16    不同时刻空泡轮廓对比
                                       Fig. 16    Comparison of cavitation contours at different times


                                                         113401-12

